
The Dota 2 Economy Index
Track the estimated value of the Dota 2 cosmetic market over time, built from price changes in a fixed basket of items.
Estimated Dota 2 cosmetic market value
+47.5% since Jul 7, 24estimated market value · 9,194-item basket · latest $1.542B
*An estimate, not a market cap: nobody publishes how many copies of each item exist. Trends, percentages and category shares come from price changes in a fixed basket of items, scaled to a documented historical starting value.
Estimated value by category
+45.9% since Jul 7, 24Price history for baskets of the top 9,194 items — 834 dated points per category. When coverage changes, new data is chain-linked so the historical baseline stays the same.
Market breadth
2026-10-11 → 2026-10-18Where the value sits — by category
By rarity tier
Highest 30-day volume
The Dota 2 cosmetics with the highest 30-day volume.
 Hallowed Chest of the Diretide$0.07Steam priceMarketplace low: $0.03 · Market Dota 2357310 · 30-day volume
 Frostivus 2023 Treasure Chest$0.11Steam priceMarketplace low: $0.04 · Market Dota 2328372 · 30-day volume
 Dead Reckoning Chest$0.31Steam priceMarketplace low: $0.17 · Skinport154439 · 30-day volume
 Span of Sorrow$0.41Steam priceMarketplace low: $0.26 · lisskins17457 · 30-day volume
 Scythes of Sorrow$0.40Steam priceMarketplace low: $0.26 · lisskins16967 · 30-day volume
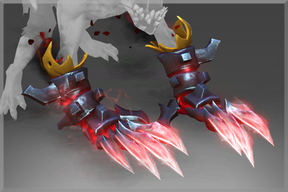 Dread Requisition$0.20Steam priceMarketplace low: $0.14 · Market Dota 214650 · 30-day volume
 Judgement of the Fallen$0.37Steam priceMarketplace low: $0.24 · lisskins14393 · 30-day volume
 Twilight Schism$0.53Steam priceMarketplace low: $0.27 · DMarket14056 · 30-day volume
 Eyes of Ardenok$0.31Steam priceMarketplace low: $0.19 · CS.TRADE14007 · 30-day volume
 Vigil Odyssey$0.43Steam priceMarketplace low: $0.20 · Skinport13951 · 30-day volume
Dig into the market
Included: all priced items and, for the long-term index, items with comparable prices in the fixed basket. Not included: item supply, private trades and items without matching history.
Related guides
Frequently asked questions
What is the Dota 2 Economy Index?
It estimates the value of the Dota 2 cosmetic market over time. Price changes in a fixed basket of items drive the trend, and the dollar level is scaled to a documented starting value. Item supply is unknown, so it is not a market cap.
Where does the data come from?
From third-party price data. The multi-year line uses dated prices, chained month over month across comparable items.
What does "market breadth" mean?
Breadth compares how many items rose versus fell over the recent window. A market can tick up in total value while most items fall — breadth shows whether a move is broad or driven by a few big items.
See the movers →